Text version:
Please note: this text may be incomplete. For more information about this OCR, view
About OCR text.
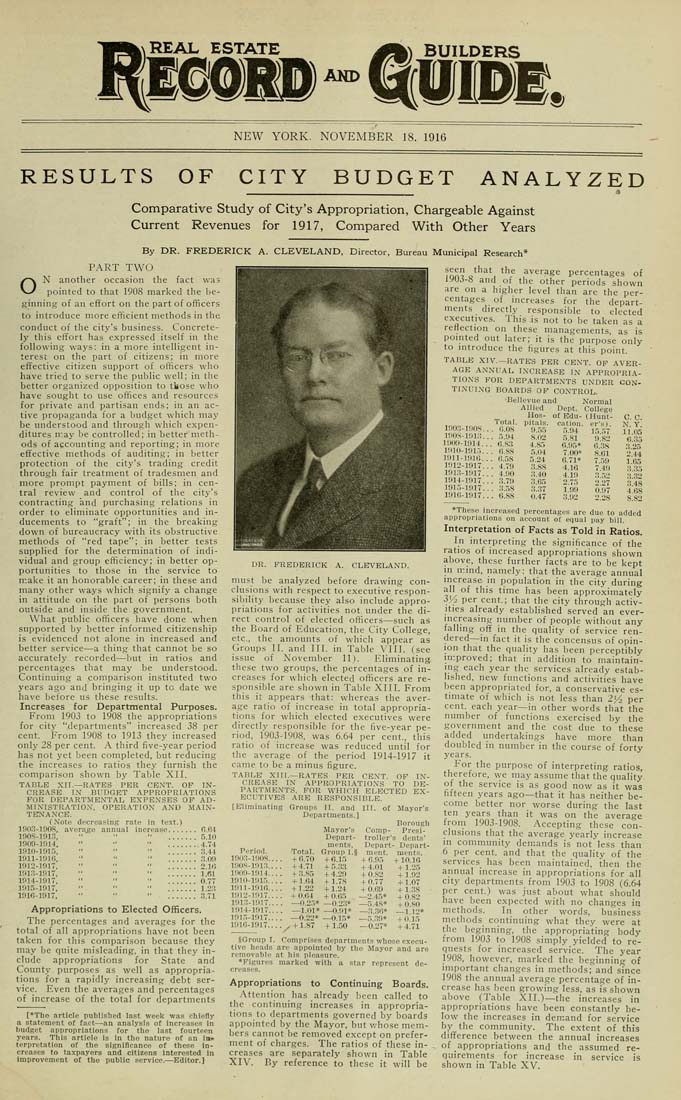
REAL ESTATE AKD NEW YORK. NOVEMBER 18, 1916 RESULTS OF CITY BUDGET ANALYZED Comparative Study of City's Appropriation, Chargeable Against Current Revenues for 1917, Compared With Other Years By DR. FREDERICK A. CLEVELAND, Director, Bureau Municipal Research* PART TWO ON another occasion the fact 'was pointed to that 1908 marked the be¬ ginning of an effort on the part of officers to introduce more efficient methods in the conduct of the city's business. Concrete¬ ly this effort has expressed itself in the following ways: in a more intelligent in¬ terest on the part of citizens; in more eft'ective citizen support of officers who have tried to serve the public w'ell; in the better organized opposition to tbose who have sought to use offices and resources for private and partisan ends; in an ac¬ tive propa,ganda for a budget which may be understood and through which expen¬ ditures may be controlled; in better meth¬ ods of accounting and reporting; in more effective methods of auditing; in better protection of the city's trading credit through fair treatment of tradesmen and more prompt payment of bills; in cen¬ tral review and control of the city's contracting and purchasing relations in order to eliminate opportunities and in¬ ducements to "graft"; in the breaking- down of bureaucracy with its obstructive methods of "red tape"; in better tests supplied for the determination of indi¬ vidual and group efficiency; in better op¬ portunities to those in the service to make it an honorable career; in these and many other ways which signify a change in attitude on the part of persons both outside and inside the government. What public officers have done when supported by better informed citizenship is evidenced not alone in increased and better service—a thing that cannot be so accurately recorded—but in ratios and percentages that may be understood. Continuing a comparison instituted two years ago and bringing it up tc date we have before us these results. Increases for Departmental Purposes. From 1903 to 1908 the appropriations for city "departments" increased 38 per cent. From 1908 to 1913 they increased only 28 per cent. A third five-year period has not j'et been completed, but reducing the increases to ratios they furnish the comparison shown by Table XII. TADLE XII.—RATES PER CENT. OF IN¬ CREASE I.NT BUDGET APPROPRIATIONS FOR DEPARTMB.^TAL EXPENSES OF AD¬ MINISTRATION, OPERATIO.N' A.ND MAIN- TE7NA.VCE. (Note decreasing rate in text.) mo.l-inOS, average annual increase....... fi.6t inns-lil1.3, " " " .. ]0
.4S* + 0.80 —.1..16* —1.12* —5.30* + 0.15 —0.27* + 4.71 §Group I. Comprises departments whose execu¬ tive heads are appointed by the Mayor and are removable at his pleasure. *Figures marked with a star represent de¬ creases. Appropriations to Continuing Boards. Attention has already been called to the continuing increases in appropria¬ tions to departments governed by boards appointed by the Mayor, but v.'hose mem¬ bers cannot be removed except on prefer¬ ment of charges. The ratios of these in¬ creases are separately shown in Table XIV. By reference to these it will be 15.57 9.82 6.38 8.61 7.59 7.40 3..52 2.27 0.97 2.2S C. C. N. Y. 11.05 6.35 3.25 2.44 1.65 3.35 3.32 3.48 4.68 S.82 mn? o _, ^ '^ average percentages of iy03-8 and of the other periods shown are on a higher level than are the per¬ centages of increases for the depart¬ ments directly responsible to elected executives. This is not to be taken as a reliection on these managements, as is pointed out later; it is the purpose only to introduce the figures at this point. TABLE XIV.—RATE'S PER CENT. OF AVER¬ AGE ANNUAL INCREASE IN APPROPRIA¬ TIONS FOR DEPARTMENTS UNDER CON¬ TINUING BOARDS OF CONTROL. Bellevue and Normal Allied Dept. College Hos- of Bdu- (Hunt- .,..^, . „, Total, pitals. cation, er's) 1003-1008.. . 0.08 9.55 5 94 100S-1013... r^M 8.02 5 81 1000-1014... 0.83 4.85 6.95* 1010-101.-,... 0.88 !5.04 7 00* 1011-1010... 0..5S 5.24 6 71* 1012-1917... 4.79 .1.88 4.16 1013-1017... 4.00 3.40 4.19 1914-1917... 3.79 3.65 2.75 1915-1917... 3.58 3.37 199 1910-1017... 0.88 0.47 3.02 *These increased percentages are due to added appropriations on account ol equal pay bill. Interpretation of Facts as Told in Ratios. In interpreting the significance of the ratios of increased appropriations shown above, these further facts are to be kept in ir.md, namely: that the average annual increase in population in the city during all of this time has been approximately 3y2 per cent.; that the city through activ¬ ities already established served an ever- increasing number of people without any falling off in tlie quality of service ren¬ dered—in fact it is the concensus of opin¬ ion that the quality has been perceptibly nr.proved; that in addition to maintain¬ ing each year the services already estab¬ lished, new functions and activities have been appropriated for, a conservative es¬ timate of which is not less than 2^^ per cent, each year—in other words that the number of functions exercised by the government and the cost due to these added undertakings have more than doubled in number in the course of forty years. For the purpose of interpreting ratios, therefore, we may assume tliat the quality of the service is as good now as it was fifteen years ago—that it has neither be¬ come better nor worse during the last ten years than it was on the average from 1903-1908. Accepting these con¬ clusions that the average yearly increase in community demands is not less than 6 per cent, and that the quality of the services has been maintained, then the annual increase in appropriations for all city departments from 1903 to 1908 (6.64 per cent.) was just about what should have been expected with no changes in methods. In other words, business methods continuing what they were at the beginning, the appropriating body from 1903 to 1908 simply yielded to re¬ quests for increased service. The year 1908, however, marked the beginning of important changes in methods; and since 1908 the annual average percentage of in¬ crease has been growing less, as is shown above (Table XII.)—the increases in appropriations have been constantly be¬ low the increases in demand for service by the community. The extent of this difference between the annual increases of appropriations and the assumed re¬ quirements for increase in service is shown in Table XV.